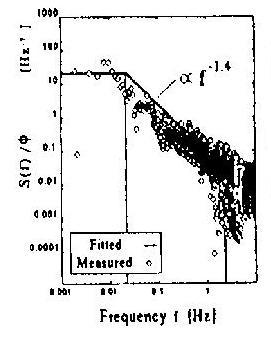
Figure 4 Power spectrum for flame fluctuation of candle A
(Adapted from [1])
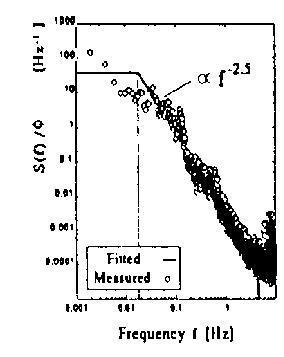
Figure 5 Power spectrum for flame fluctuation of candle B
(Adapted from [1])
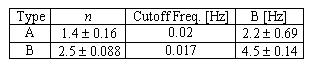
Appendix BTwo examples from Fujiwara et al [1] are shown below which represent two different candles:
Figure 4 Power spectrum for flame fluctuation of candle A
(Adapted from [1])
Figure 5 Power spectrum for flame fluctuation of candle B
(Adapted from [1])
Figures 4 and 5 have to two important features. They have a flat region at low frequencies and 1/f at high frequencies. Note how these figures are similar to figure one.
Figures 4 and 5 have fall off as 1/f^1.4 and 1/f^2.5 at high frequencies respectively (a low pass filter has a slope of 1/f2).